<?xml version="1.0" encoding="utf-8"?><feed xmlns="http://www.w3.org/2005/Atom" ><generator uri="https://jekyllrb.com/" version="4.3.2">Jekyll</generator><link href="https://blog.exploreportfolio.com/feed.xml" rel="self" type="application/atom+xml" /><link href="https://blog.exploreportfolio.com/" rel="alternate" type="text/html" /><updated>2023-06-23T18:42:14+02:00</updated><id>https://blog.exploreportfolio.com/feed.xml</id><title type="html">ExplorePortfolio Blog</title><subtitle>ExplorePortfolio Blog</subtitle><author><name>Filip Zivanovic</name><email>support@exploreportfolio.com</email></author><entry><title type="html">Arithmetic vs Logarithmic Returns - What Investors Need to Know</title><link href="https://blog.exploreportfolio.com/simple-vs-log-returns/" rel="alternate" type="text/html" title="Arithmetic vs Logarithmic Returns - What Investors Need to Know" /><published>2023-04-01T18:11:00+02:00</published><updated>2023-04-01T18:11:00+02:00</updated><id>https://blog.exploreportfolio.com/simple-vs-log-returns</id><content type="html" xml:base="https://blog.exploreportfolio.com/simple-vs-log-returns/"><![CDATA[<p>The article explains the difference between arithmetic and logarithmic returns, and why it’s important for investors to understand the distinction. 
Arithmetic returns are simple to calculate but can be misleading when it comes to understanding the impact of compounding returns. Logarithmic returns, on the other hand, provide a more accurate picture of the actual returns on an investment by taking into account the effect of compounding. The article concludes that understanding the difference between these two methods is essential for making informed investment decisions and achieving better long-term investment outcomes.</p>

<p>Arithmetic and logarithmic returns are two ways of measuring the change in an investment’s value over a period of time.</p>

<h3 id="arithmetic-returns">Arithmetic returns</h3>

<p>Arithmetic returns, also known as simple returns, are calculated by taking the difference between the ending value of the investment and the beginning value, and then dividing by the beginning value. The formula is:</p>

<span class="katex-display"><span class="katex"><span class="katex-mathml"><math xmlns="http://www.w3.org/1998/Math/MathML" display="block"><semantics><mrow><mi>A</mi><mi>r</mi><mi>i</mi><mi>t</mi><mi>h</mi><mi>m</mi><mi>e</mi><mi>t</mi><mi>i</mi><mi>c</mi><mi>R</mi><mi>e</mi><mi>t</mi><mi>u</mi><mi>r</mi><mi>n</mi><mo>=</mo><mfrac><mrow><mi>C</mi><mi>l</mi><mi>o</mi><mi>s</mi><mi>e</mi><mi>P</mi><mi>r</mi><mi>i</mi><mi>c</mi><mi>e</mi><mo>−</mo><mi>O</mi><mi>p</mi><mi>e</mi><mi>n</mi><mi>P</mi><mi>r</mi><mi>i</mi><mi>c</mi><mi>e</mi></mrow><mrow><mi>O</mi><mi>p</mi><mi>e</mi><mi>n</mi><mi>P</mi><mi>r</mi><mi>i</mi><mi>c</mi><mi>e</mi></mrow></mfrac></mrow><annotation encoding="application/x-tex">ArithmeticReturn = \dfrac{ClosePrice  - OpenPrice}{OpenPrice}</annotation></semantics></math></span><span class="katex-html" aria-hidden="true"><span class="base"><span class="strut" style="height:0.6944em;"></span><span class="mord mathnormal">A</span><span class="mord mathnormal" style="margin-right:0.02778em;">r</span><span class="mord mathnormal">i</span><span class="mord mathnormal">t</span><span class="mord mathnormal">hm</span><span class="mord mathnormal">e</span><span class="mord mathnormal">t</span><span class="mord mathnormal">i</span><span class="mord mathnormal">c</span><span class="mord mathnormal" style="margin-right:0.00773em;">R</span><span class="mord mathnormal">e</span><span class="mord mathnormal">t</span><span class="mord mathnormal">u</span><span class="mord mathnormal" style="margin-right:0.02778em;">r</span><span class="mord mathnormal">n</span><span class="mspace" style="margin-right:0.2778em;"></span><span class="mrel">=</span><span class="mspace" style="margin-right:0.2778em;"></span></span><span class="base"><span class="strut" style="height:2.2519em;vertical-align:-0.8804em;"></span><span class="mord"><span class="mopen nulldelimiter"></span><span class="mfrac"><span class="vlist-t vlist-t2"><span class="vlist-r"><span class="vlist" style="height:1.3714em;"><span style="top:-2.314em;"><span class="pstrut" style="height:3em;"></span><span class="mord"><span class="mord mathnormal">Op</span><span class="mord mathnormal">e</span><span class="mord mathnormal">n</span><span class="mord mathnormal" style="margin-right:0.13889em;">P</span><span class="mord mathnormal" style="margin-right:0.02778em;">r</span><span class="mord mathnormal">i</span><span class="mord mathnormal">ce</span></span></span><span style="top:-3.23em;"><span class="pstrut" style="height:3em;"></span><span class="frac-line" style="border-bottom-width:0.04em;"></span></span><span style="top:-3.677em;"><span class="pstrut" style="height:3em;"></span><span class="mord"><span class="mord mathnormal" style="margin-right:0.01968em;">Cl</span><span class="mord mathnormal">ose</span><span class="mord mathnormal" style="margin-right:0.13889em;">P</span><span class="mord mathnormal" style="margin-right:0.02778em;">r</span><span class="mord mathnormal">i</span><span class="mord mathnormal">ce</span><span class="mspace" style="margin-right:0.2222em;"></span><span class="mbin">−</span><span class="mspace" style="margin-right:0.2222em;"></span><span class="mord mathnormal">Op</span><span class="mord mathnormal">e</span><span class="mord mathnormal">n</span><span class="mord mathnormal" style="margin-right:0.13889em;">P</span><span class="mord mathnormal" style="margin-right:0.02778em;">r</span><span class="mord mathnormal">i</span><span class="mord mathnormal">ce</span></span></span></span><span class="vlist-s">​</span></span><span class="vlist-r"><span class="vlist" style="height:0.8804em;"><span></span></span></span></span></span><span class="mclose nulldelimiter"></span></span></span></span></span></span>

<p>
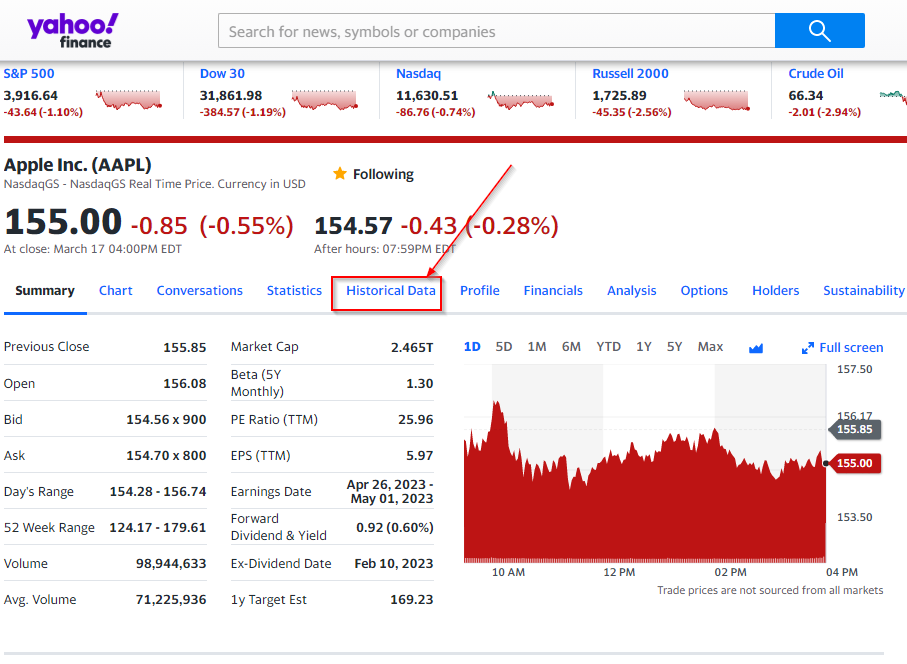
For example, To calculate the arithmetic return for Apple stock, you’ll need the beginning and ending stock prices for a specific period. Let’s say you want to calculate the arithmetic return for Apple stock for the month of January 2023. Here are the hypothetical stock prices:</p>

<ul>
  <li>Beginning stock price on January 1, 2023: $150</li>
  <li>Ending stock price on January 31, 2023: $165</li>
</ul>

<p>Now, we can calculate the arithmetic return using the formula mentioned earlier:</p>

<span class="katex-display"><span class="katex"><span class="katex-mathml"><math xmlns="http://www.w3.org/1998/Math/MathML" display="block"><semantics><mrow><mi>A</mi><mi>r</mi><mi>i</mi><mi>t</mi><mi>h</mi><mi>m</mi><mi>e</mi><mi>t</mi><mi>i</mi><mi>c</mi><mi>R</mi><mi>e</mi><mi>t</mi><mi>u</mi><mi>r</mi><mi>n</mi><mo>=</mo><mfrac><mrow><mi mathvariant="normal">$</mi><mn>165</mn><mo>−</mo><mi mathvariant="normal">$</mi><mn>150</mn></mrow><mrow><mi mathvariant="normal">$</mi><mn>150</mn></mrow></mfrac></mrow><annotation encoding="application/x-tex">ArithmeticReturn = \dfrac{\$165  - \$150}{\$150}</annotation></semantics></math></span><span class="katex-html" aria-hidden="true"><span class="base"><span class="strut" style="height:0.6944em;"></span><span class="mord mathnormal">A</span><span class="mord mathnormal" style="margin-right:0.02778em;">r</span><span class="mord mathnormal">i</span><span class="mord mathnormal">t</span><span class="mord mathnormal">hm</span><span class="mord mathnormal">e</span><span class="mord mathnormal">t</span><span class="mord mathnormal">i</span><span class="mord mathnormal">c</span><span class="mord mathnormal" style="margin-right:0.00773em;">R</span><span class="mord mathnormal">e</span><span class="mord mathnormal">t</span><span class="mord mathnormal">u</span><span class="mord mathnormal" style="margin-right:0.02778em;">r</span><span class="mord mathnormal">n</span><span class="mspace" style="margin-right:0.2778em;"></span><span class="mrel">=</span><span class="mspace" style="margin-right:0.2778em;"></span></span><span class="base"><span class="strut" style="height:2.1686em;vertical-align:-0.7416em;"></span><span class="mord"><span class="mopen nulldelimiter"></span><span class="mfrac"><span class="vlist-t vlist-t2"><span class="vlist-r"><span class="vlist" style="height:1.427em;"><span style="top:-2.314em;"><span class="pstrut" style="height:3em;"></span><span class="mord"><span class="mord">$150</span></span></span><span style="top:-3.23em;"><span class="pstrut" style="height:3em;"></span><span class="frac-line" style="border-bottom-width:0.04em;"></span></span><span style="top:-3.677em;"><span class="pstrut" style="height:3em;"></span><span class="mord"><span class="mord">$165</span><span class="mspace" style="margin-right:0.2222em;"></span><span class="mbin">−</span><span class="mspace" style="margin-right:0.2222em;"></span><span class="mord">$150</span></span></span></span><span class="vlist-s">​</span></span><span class="vlist-r"><span class="vlist" style="height:0.7416em;"><span></span></span></span></span></span><span class="mclose nulldelimiter"></span></span></span></span></span></span>

<p>The arithmetic return for Apple stock in January 2023 is 0.10, or 10%. This means that the stock’s value increased by 10% during that month.</p>

<h3 id="logarithmic-returns">Logarithmic returns</h3>

<p>
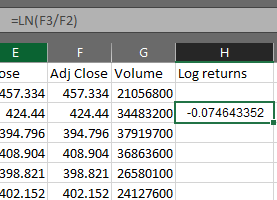
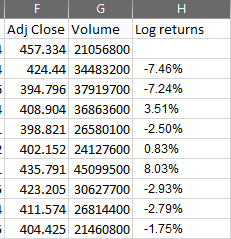
Log returns, also known as continuously compounded returns, are calculated by taking the natural logarithm of the ratio of the ending value to the beginning value. The formula is:</p>

<span class="katex-display"><span class="katex"><span class="katex-mathml"><math xmlns="http://www.w3.org/1998/Math/MathML" display="block"><semantics><mrow><mi>L</mi><mi>o</mi><mi>g</mi><mi>R</mi><mi>e</mi><mi>t</mi><mi>u</mi><mi>r</mi><mi>n</mi><mo>=</mo><mi>l</mi><mi>n</mi><mo stretchy="false">(</mo><mfrac><mrow><mi>C</mi><mi>l</mi><mi>o</mi><mi>s</mi><mi>e</mi><mi>P</mi><mi>r</mi><mi>i</mi><mi>c</mi><mi>e</mi></mrow><mrow><mi>O</mi><mi>p</mi><mi>e</mi><mi>n</mi><mi>P</mi><mi>r</mi><mi>i</mi><mi>c</mi><mi>e</mi></mrow></mfrac><mo stretchy="false">)</mo></mrow><annotation encoding="application/x-tex">LogReturn = ln(\dfrac{ClosePrice}{OpenPrice})</annotation></semantics></math></span><span class="katex-html" aria-hidden="true"><span class="base"><span class="strut" style="height:0.8778em;vertical-align:-0.1944em;"></span><span class="mord mathnormal">L</span><span class="mord mathnormal">o</span><span class="mord mathnormal" style="margin-right:0.03588em;">g</span><span class="mord mathnormal" style="margin-right:0.00773em;">R</span><span class="mord mathnormal">e</span><span class="mord mathnormal">t</span><span class="mord mathnormal">u</span><span class="mord mathnormal" style="margin-right:0.02778em;">r</span><span class="mord mathnormal">n</span><span class="mspace" style="margin-right:0.2778em;"></span><span class="mrel">=</span><span class="mspace" style="margin-right:0.2778em;"></span></span><span class="base"><span class="strut" style="height:2.2519em;vertical-align:-0.8804em;"></span><span class="mord mathnormal" style="margin-right:0.01968em;">l</span><span class="mord mathnormal">n</span><span class="mopen">(</span><span class="mord"><span class="mopen nulldelimiter"></span><span class="mfrac"><span class="vlist-t vlist-t2"><span class="vlist-r"><span class="vlist" style="height:1.3714em;"><span style="top:-2.314em;"><span class="pstrut" style="height:3em;"></span><span class="mord"><span class="mord mathnormal">Op</span><span class="mord mathnormal">e</span><span class="mord mathnormal">n</span><span class="mord mathnormal" style="margin-right:0.13889em;">P</span><span class="mord mathnormal" style="margin-right:0.02778em;">r</span><span class="mord mathnormal">i</span><span class="mord mathnormal">ce</span></span></span><span style="top:-3.23em;"><span class="pstrut" style="height:3em;"></span><span class="frac-line" style="border-bottom-width:0.04em;"></span></span><span style="top:-3.677em;"><span class="pstrut" style="height:3em;"></span><span class="mord"><span class="mord mathnormal" style="margin-right:0.01968em;">Cl</span><span class="mord mathnormal">ose</span><span class="mord mathnormal" style="margin-right:0.13889em;">P</span><span class="mord mathnormal" style="margin-right:0.02778em;">r</span><span class="mord mathnormal">i</span><span class="mord mathnormal">ce</span></span></span></span><span class="vlist-s">​</span></span><span class="vlist-r"><span class="vlist" style="height:0.8804em;"><span></span></span></span></span></span><span class="mclose nulldelimiter"></span></span><span class="mclose">)</span></span></span></span></span>

<p>Log returns have a few advantages over arithmetic returns. They are additive across time, meaning that the log return of multiple non-overlapping periods can be found by summing the log returns of each period. This property makes log returns particularly useful for analyzing returns over multiple periods or when calculating portfolio returns. Log returns also exhibit better statistical properties, such as being approximately normally distributed in many cases.</p>

<p>For example, to calculate the log return for Apple stock, you’ll need the beginning and ending stock prices for a specific period. Let’s use the same example as before, calculating the log return for Apple stock for the month of January 2023 with these hypothetical stock prices:</p>

<ul>
  <li>Beginning stock price on January 1, 2023: $150</li>
  <li>Ending stock price on January 31, 2023: $165</li>
</ul>

<p>Now, we can calculate the log return using the formula mentioned earlier:</p>

<span class="katex-display"><span class="katex"><span class="katex-mathml"><math xmlns="http://www.w3.org/1998/Math/MathML" display="block"><semantics><mrow><mi>L</mi><mi>o</mi><mi>g</mi><mi>R</mi><mi>e</mi><mi>t</mi><mi>u</mi><mi>r</mi><mi>n</mi><mo>=</mo><mi>l</mi><mi>n</mi><mo stretchy="false">(</mo><mfrac><mrow><mi mathvariant="normal">$</mi><mn>165</mn></mrow><mrow><mi mathvariant="normal">$</mi><mn>150</mn></mrow></mfrac><mo stretchy="false">)</mo></mrow><annotation encoding="application/x-tex">LogReturn = ln(\dfrac{\$165}{\$150})</annotation></semantics></math></span><span class="katex-html" aria-hidden="true"><span class="base"><span class="strut" style="height:0.8778em;vertical-align:-0.1944em;"></span><span class="mord mathnormal">L</span><span class="mord mathnormal">o</span><span class="mord mathnormal" style="margin-right:0.03588em;">g</span><span class="mord mathnormal" style="margin-right:0.00773em;">R</span><span class="mord mathnormal">e</span><span class="mord mathnormal">t</span><span class="mord mathnormal">u</span><span class="mord mathnormal" style="margin-right:0.02778em;">r</span><span class="mord mathnormal">n</span><span class="mspace" style="margin-right:0.2778em;"></span><span class="mrel">=</span><span class="mspace" style="margin-right:0.2778em;"></span></span><span class="base"><span class="strut" style="height:2.1686em;vertical-align:-0.7416em;"></span><span class="mord mathnormal" style="margin-right:0.01968em;">l</span><span class="mord mathnormal">n</span><span class="mopen">(</span><span class="mord"><span class="mopen nulldelimiter"></span><span class="mfrac"><span class="vlist-t vlist-t2"><span class="vlist-r"><span class="vlist" style="height:1.427em;"><span style="top:-2.314em;"><span class="pstrut" style="height:3em;"></span><span class="mord"><span class="mord">$150</span></span></span><span style="top:-3.23em;"><span class="pstrut" style="height:3em;"></span><span class="frac-line" style="border-bottom-width:0.04em;"></span></span><span style="top:-3.677em;"><span class="pstrut" style="height:3em;"></span><span class="mord"><span class="mord">$165</span></span></span></span><span class="vlist-s">​</span></span><span class="vlist-r"><span class="vlist" style="height:0.7416em;"><span></span></span></span></span></span><span class="mclose nulldelimiter"></span></span><span class="mclose">)</span></span></span></span></span>

<span class="katex-display"><span class="katex"><span class="katex-mathml"><math xmlns="http://www.w3.org/1998/Math/MathML" display="block"><semantics><mrow><mi>L</mi><mi>o</mi><mi>g</mi><mi>R</mi><mi>e</mi><mi>t</mi><mi>u</mi><mi>r</mi><mi>n</mi><mo>=</mo><mi>l</mi><mi>n</mi><mo stretchy="false">(</mo><mn>1.10</mn><mo stretchy="false">)</mo></mrow><annotation encoding="application/x-tex">LogReturn = ln(1.10)</annotation></semantics></math></span><span class="katex-html" aria-hidden="true"><span class="base"><span class="strut" style="height:0.8778em;vertical-align:-0.1944em;"></span><span class="mord mathnormal">L</span><span class="mord mathnormal">o</span><span class="mord mathnormal" style="margin-right:0.03588em;">g</span><span class="mord mathnormal" style="margin-right:0.00773em;">R</span><span class="mord mathnormal">e</span><span class="mord mathnormal">t</span><span class="mord mathnormal">u</span><span class="mord mathnormal" style="margin-right:0.02778em;">r</span><span class="mord mathnormal">n</span><span class="mspace" style="margin-right:0.2778em;"></span><span class="mrel">=</span><span class="mspace" style="margin-right:0.2778em;"></span></span><span class="base"><span class="strut" style="height:1em;vertical-align:-0.25em;"></span><span class="mord mathnormal" style="margin-right:0.01968em;">l</span><span class="mord mathnormal">n</span><span class="mopen">(</span><span class="mord">1.10</span><span class="mclose">)</span></span></span></span></span>

<span class="katex-display"><span class="katex"><span class="katex-mathml"><math xmlns="http://www.w3.org/1998/Math/MathML" display="block"><semantics><mrow><mi>L</mi><mi>o</mi><mi>g</mi><mi>R</mi><mi>e</mi><mi>t</mi><mi>u</mi><mi>r</mi><mi>n</mi><mo>≈</mo><mn>0.0953</mn></mrow><annotation encoding="application/x-tex">LogReturn \approx 0.0953</annotation></semantics></math></span><span class="katex-html" aria-hidden="true"><span class="base"><span class="strut" style="height:0.8778em;vertical-align:-0.1944em;"></span><span class="mord mathnormal">L</span><span class="mord mathnormal">o</span><span class="mord mathnormal" style="margin-right:0.03588em;">g</span><span class="mord mathnormal" style="margin-right:0.00773em;">R</span><span class="mord mathnormal">e</span><span class="mord mathnormal">t</span><span class="mord mathnormal">u</span><span class="mord mathnormal" style="margin-right:0.02778em;">r</span><span class="mord mathnormal">n</span><span class="mspace" style="margin-right:0.2778em;"></span><span class="mrel">≈</span><span class="mspace" style="margin-right:0.2778em;"></span></span><span class="base"><span class="strut" style="height:0.6444em;"></span><span class="mord">0.0953</span></span></span></span></span>

<p>The log return for Apple stock in January 2023 is approximately 0.0953, or 9.53%. This means that the stock’s value increased by about 9.53% during that month, when accounting for the compounding effect.</p>

<p>It’s important to note that while the log return and arithmetic return values are close, they are not identical. The log return is more appropriate for multi-period analysis or when considering compounding effects, while the arithmetic return is easier to understand and suitable for single-period calculations.</p>

<h3 id="additive-properties-of-logarithmic-returns">Additive properties of Logarithmic returns</h3>

<p>The additive property of log returns allows you to calculate the overall return of an investment over multiple non-overlapping periods by simply summing the log returns of each period. Let’s use Apple stock as an example with hypothetical data for three consecutive months:</p>

<table>
  <thead>
    <tr>
      <th>Date</th>
      <th style="text-align: right">Price</th>
    </tr>
  </thead>
  <tbody>
    <tr>
      <td>January 1, 2023</td>
      <td style="text-align: right">$150</td>
    </tr>
    <tr>
      <td>February 1, 2023</td>
      <td style="text-align: right">$165</td>
    </tr>
    <tr>
      <td>March 1, 2023</td>
      <td style="text-align: right">$180</td>
    </tr>
    <tr>
      <td>April 1, 2023</td>
      <td style="text-align: right">$190</td>
    </tr>
  </tbody>
</table>

<p>First, we’ll calculate the log returns for each month:</p>

<span class="katex-display"><span class="katex"><span class="katex-mathml"><math xmlns="http://www.w3.org/1998/Math/MathML" display="block"><semantics><mrow><mi>J</mi><mi>a</mi><mi>n</mi><mi>u</mi><mi>a</mi><mi>r</mi><mi>y</mi><mn>2023</mn><mo>=</mo><mi>l</mi><mi>n</mi><mo stretchy="false">(</mo><mfrac><mrow><mi mathvariant="normal">$</mi><mn>165</mn></mrow><mrow><mi mathvariant="normal">$</mi><mn>150</mn></mrow></mfrac><mo stretchy="false">)</mo><mo>≈</mo><mn>0.0953</mn></mrow><annotation encoding="application/x-tex">January 2023 = ln(\dfrac{\$165}{\$150}) \approx 0.0953</annotation></semantics></math></span><span class="katex-html" aria-hidden="true"><span class="base"><span class="strut" style="height:0.8778em;vertical-align:-0.1944em;"></span><span class="mord mathnormal" style="margin-right:0.09618em;">J</span><span class="mord mathnormal">an</span><span class="mord mathnormal">u</span><span class="mord mathnormal">a</span><span class="mord mathnormal" style="margin-right:0.03588em;">ry</span><span class="mord">2023</span><span class="mspace" style="margin-right:0.2778em;"></span><span class="mrel">=</span><span class="mspace" style="margin-right:0.2778em;"></span></span><span class="base"><span class="strut" style="height:2.1686em;vertical-align:-0.7416em;"></span><span class="mord mathnormal" style="margin-right:0.01968em;">l</span><span class="mord mathnormal">n</span><span class="mopen">(</span><span class="mord"><span class="mopen nulldelimiter"></span><span class="mfrac"><span class="vlist-t vlist-t2"><span class="vlist-r"><span class="vlist" style="height:1.427em;"><span style="top:-2.314em;"><span class="pstrut" style="height:3em;"></span><span class="mord"><span class="mord">$150</span></span></span><span style="top:-3.23em;"><span class="pstrut" style="height:3em;"></span><span class="frac-line" style="border-bottom-width:0.04em;"></span></span><span style="top:-3.677em;"><span class="pstrut" style="height:3em;"></span><span class="mord"><span class="mord">$165</span></span></span></span><span class="vlist-s">​</span></span><span class="vlist-r"><span class="vlist" style="height:0.7416em;"><span></span></span></span></span></span><span class="mclose nulldelimiter"></span></span><span class="mclose">)</span><span class="mspace" style="margin-right:0.2778em;"></span><span class="mrel">≈</span><span class="mspace" style="margin-right:0.2778em;"></span></span><span class="base"><span class="strut" style="height:0.6444em;"></span><span class="mord">0.0953</span></span></span></span></span>

<span class="katex-display"><span class="katex"><span class="katex-mathml"><math xmlns="http://www.w3.org/1998/Math/MathML" display="block"><semantics><mrow><mi>F</mi><mi>e</mi><mi>b</mi><mi>r</mi><mi>u</mi><mi>a</mi><mi>r</mi><mi>y</mi><mn>2023</mn><mo>=</mo><mi>l</mi><mi>n</mi><mo stretchy="false">(</mo><mfrac><mrow><mi mathvariant="normal">$</mi><mn>180</mn></mrow><mrow><mi mathvariant="normal">$</mi><mn>165</mn></mrow></mfrac><mo stretchy="false">)</mo><mo>≈</mo><mn>0.0870</mn></mrow><annotation encoding="application/x-tex">February 2023 = ln(\dfrac{\$180}{\$165}) \approx 0.0870</annotation></semantics></math></span><span class="katex-html" aria-hidden="true"><span class="base"><span class="strut" style="height:0.8889em;vertical-align:-0.1944em;"></span><span class="mord mathnormal" style="margin-right:0.13889em;">F</span><span class="mord mathnormal">e</span><span class="mord mathnormal">b</span><span class="mord mathnormal" style="margin-right:0.02778em;">r</span><span class="mord mathnormal">u</span><span class="mord mathnormal">a</span><span class="mord mathnormal" style="margin-right:0.03588em;">ry</span><span class="mord">2023</span><span class="mspace" style="margin-right:0.2778em;"></span><span class="mrel">=</span><span class="mspace" style="margin-right:0.2778em;"></span></span><span class="base"><span class="strut" style="height:2.1686em;vertical-align:-0.7416em;"></span><span class="mord mathnormal" style="margin-right:0.01968em;">l</span><span class="mord mathnormal">n</span><span class="mopen">(</span><span class="mord"><span class="mopen nulldelimiter"></span><span class="mfrac"><span class="vlist-t vlist-t2"><span class="vlist-r"><span class="vlist" style="height:1.427em;"><span style="top:-2.314em;"><span class="pstrut" style="height:3em;"></span><span class="mord"><span class="mord">$165</span></span></span><span style="top:-3.23em;"><span class="pstrut" style="height:3em;"></span><span class="frac-line" style="border-bottom-width:0.04em;"></span></span><span style="top:-3.677em;"><span class="pstrut" style="height:3em;"></span><span class="mord"><span class="mord">$180</span></span></span></span><span class="vlist-s">​</span></span><span class="vlist-r"><span class="vlist" style="height:0.7416em;"><span></span></span></span></span></span><span class="mclose nulldelimiter"></span></span><span class="mclose">)</span><span class="mspace" style="margin-right:0.2778em;"></span><span class="mrel">≈</span><span class="mspace" style="margin-right:0.2778em;"></span></span><span class="base"><span class="strut" style="height:0.6444em;"></span><span class="mord">0.0870</span></span></span></span></span>

<span class="katex-display"><span class="katex"><span class="katex-mathml"><math xmlns="http://www.w3.org/1998/Math/MathML" display="block"><semantics><mrow><mi>M</mi><mi>a</mi><mi>r</mi><mi>c</mi><mi>h</mi><mn>2023</mn><mo>=</mo><mi>l</mi><mi>n</mi><mo stretchy="false">(</mo><mfrac><mrow><mi mathvariant="normal">$</mi><mn>190</mn></mrow><mrow><mi mathvariant="normal">$</mi><mn>180</mn></mrow></mfrac><mo stretchy="false">)</mo><mo>≈</mo><mn>0.0531</mn></mrow><annotation encoding="application/x-tex">March 2023 = ln(\dfrac{\$190}{\$180}) \approx 0.0531</annotation></semantics></math></span><span class="katex-html" aria-hidden="true"><span class="base"><span class="strut" style="height:0.6944em;"></span><span class="mord mathnormal" style="margin-right:0.10903em;">M</span><span class="mord mathnormal">a</span><span class="mord mathnormal">rc</span><span class="mord mathnormal">h</span><span class="mord">2023</span><span class="mspace" style="margin-right:0.2778em;"></span><span class="mrel">=</span><span class="mspace" style="margin-right:0.2778em;"></span></span><span class="base"><span class="strut" style="height:2.1686em;vertical-align:-0.7416em;"></span><span class="mord mathnormal" style="margin-right:0.01968em;">l</span><span class="mord mathnormal">n</span><span class="mopen">(</span><span class="mord"><span class="mopen nulldelimiter"></span><span class="mfrac"><span class="vlist-t vlist-t2"><span class="vlist-r"><span class="vlist" style="height:1.427em;"><span style="top:-2.314em;"><span class="pstrut" style="height:3em;"></span><span class="mord"><span class="mord">$180</span></span></span><span style="top:-3.23em;"><span class="pstrut" style="height:3em;"></span><span class="frac-line" style="border-bottom-width:0.04em;"></span></span><span style="top:-3.677em;"><span class="pstrut" style="height:3em;"></span><span class="mord"><span class="mord">$190</span></span></span></span><span class="vlist-s">​</span></span><span class="vlist-r"><span class="vlist" style="height:0.7416em;"><span></span></span></span></span></span><span class="mclose nulldelimiter"></span></span><span class="mclose">)</span><span class="mspace" style="margin-right:0.2778em;"></span><span class="mrel">≈</span><span class="mspace" style="margin-right:0.2778em;"></span></span><span class="base"><span class="strut" style="height:0.6444em;"></span><span class="mord">0.0531</span></span></span></span></span>

<p>Now, we can use the additive property of log returns to calculate the overall return for the three-month period:</p>

<span class="katex-display"><span class="katex"><span class="katex-mathml"><math xmlns="http://www.w3.org/1998/Math/MathML" display="block"><semantics><mrow><mi>T</mi><mi>o</mi><mi>t</mi><mi>a</mi><mi>l</mi><mi>L</mi><mi>o</mi><mi>g</mi><mi>R</mi><mi>e</mi><mi>t</mi><mi>u</mi><mi>r</mi><mi>n</mi><mo>=</mo><mn>0.0953</mn><mo>+</mo><mn>0.0870</mn><mo>+</mo><mn>0.0531</mn><mo>≈</mo><mn>0.2354</mn></mrow><annotation encoding="application/x-tex">Total Log Return = 0.0953 + 0.0870 + 0.0531 \approx 0.2354</annotation></semantics></math></span><span class="katex-html" aria-hidden="true"><span class="base"><span class="strut" style="height:0.8889em;vertical-align:-0.1944em;"></span><span class="mord mathnormal" style="margin-right:0.13889em;">T</span><span class="mord mathnormal">o</span><span class="mord mathnormal">t</span><span class="mord mathnormal">a</span><span class="mord mathnormal" style="margin-right:0.01968em;">l</span><span class="mord mathnormal">L</span><span class="mord mathnormal">o</span><span class="mord mathnormal" style="margin-right:0.03588em;">g</span><span class="mord mathnormal" style="margin-right:0.00773em;">R</span><span class="mord mathnormal">e</span><span class="mord mathnormal">t</span><span class="mord mathnormal">u</span><span class="mord mathnormal" style="margin-right:0.02778em;">r</span><span class="mord mathnormal">n</span><span class="mspace" style="margin-right:0.2778em;"></span><span class="mrel">=</span><span class="mspace" style="margin-right:0.2778em;"></span></span><span class="base"><span class="strut" style="height:0.7278em;vertical-align:-0.0833em;"></span><span class="mord">0.0953</span><span class="mspace" style="margin-right:0.2222em;"></span><span class="mbin">+</span><span class="mspace" style="margin-right:0.2222em;"></span></span><span class="base"><span class="strut" style="height:0.7278em;vertical-align:-0.0833em;"></span><span class="mord">0.0870</span><span class="mspace" style="margin-right:0.2222em;"></span><span class="mbin">+</span><span class="mspace" style="margin-right:0.2222em;"></span></span><span class="base"><span class="strut" style="height:0.6444em;"></span><span class="mord">0.0531</span><span class="mspace" style="margin-right:0.2778em;"></span><span class="mrel">≈</span><span class="mspace" style="margin-right:0.2778em;"></span></span><span class="base"><span class="strut" style="height:0.6444em;"></span><span class="mord">0.2354</span></span></span></span></span>

<p>The additive property of log returns simplifies the calculation of returns over multiple periods, making it particularly useful for financial analysis and portfolio management.</p>

<h3 id="the-relationship-between-arithmetic-and-log-returns">The Relationship Between Arithmetic and Log Returns</h3>
<p>The chart below exposes the relationship between arithmetic returns and log returns.</p>

<p><img src="/assets/img/Pasted%20image%2020230401183128.png" alt="Relationship and difference between arithmetic and log returns." /></p>

<p>
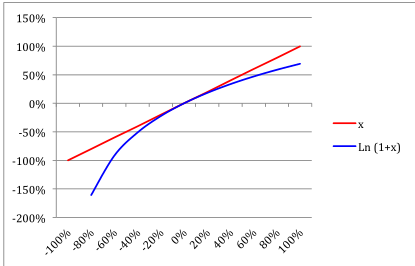
There is no one-to-one relationship between log returns and arithmetic ones; nevertheless you can note that the smaller the return, the more arithmetic and log returns tend to be similar.</p>

<h3 id="conclusion">Conclusion</h3>

<p>In conclusion, understanding the difference between arithmetic and logarithmic returns is essential for any investor who wants to make informed decisions about their portfolio. While arithmetic returns are simple to calculate and provide a clear picture of the average return over a given time period, they can be misleading when it comes to understanding the impact of compounding returns.</p>

<p>On the other hand, logarithmic returns provide a more accurate picture of the actual returns on an investment, by taking into account the impact of compounding. By using logarithmic returns, investors can make better-informed decisions about their investment strategies, and avoid being misled by simple arithmetic calculations.</p>

<p>Ultimately, whether you use arithmetic or logarithmic returns will depend on your investment goals and the specifics of your investment portfolio, but having a clear understanding of the differences between these two methods can help you achieve better long-term investment outcomes.</p>]]></content><author><name>Filip Zivanovic</name><email>support@exploreportfolio.com</email></author><category term="arithmetic" /><category term="log" /><category term="returns" /><category term="simple" /><summary type="html"><![CDATA[The article explains the difference between arithmetic and logarithmic returns, and why it's important for investors to understand the distinction. Arithmetic returns are simple to calculate but can be misleading when it comes to understanding the impact of compounding returns. Logarithmic returns, on the other hand, provide a more accurate picture of the actual returns on an investment by taking into account the effect of compounding. The article concludes that understanding the difference between these two methods is essential for making informed investment decisions and achieving better long-term investment outcomes.]]></summary></entry><entry><title type="html">Downloading Stock Historical Data from Yahoo Finance</title><link href="https://blog.exploreportfolio.com/how-to-download-historical-data-from-yahoo-finance/" rel="alternate" type="text/html" title="Downloading Stock Historical Data from Yahoo Finance" /><published>2023-03-18T22:26:00+01:00</published><updated>2023-03-18T22:26:00+01:00</updated><id>https://blog.exploreportfolio.com/how-to-download-historical-data-from-yahoo-finance</id><content type="html" xml:base="https://blog.exploreportfolio.com/how-to-download-historical-data-from-yahoo-finance/"><![CDATA[<p>This article will focus on how to download some historical data from Yahoo Finance of a stock that is of interest to you , so that you can use that data in your analysis.</p>

<p>First, go to <a href="https://finance.yahoo.com/">Yahoo Finance</a> and search for a stock symbol that is of interest to you. Let’s check how we would do exactly that with Apple stock (AAPL).</p>

<ol>
  <li>
    <p>We first search for AAPL stock in the search bar:
<img src="/assets/img/Pasted%20image%2020230318222944.png" alt="Search for stock on Yahoo Finance" /></p>
  </li>
  <li>We select APPL from the list and then once the page loads we select Historical Data tab:
<img src="/assets/img/Pasted%20image%2020230318223047.png" alt="Select symbol of a stock" /></li>
  <li>Once the Historical Data is loaded we would like to select the Time Period of our analysis. For the purpose of our analysis we will select the full historical period for AAPL:
<img src="/assets/img/Pasted%20image%2020230318223210.png" alt="Select the time period of historical data" /></li>
  <li>Next step is to download the Historical Data in CSV format:
<img src="/assets/img/Pasted%20image%2020230318223307.png" alt="Download historical data in CSV format" /></li>
  <li>Excel can automatically recognize the CSV format and will open once downloaded:
<img src="/assets/img/Pasted%20image%2020230318223450.png" alt="Excel open CSV data when downloaded" /></li>
  <li>Once opened in Excel our data is ready for further analysis:
<img src="/assets/img/Pasted%20image%2020230318223543.png" alt="Historical data ready for analysis" /></li>
</ol>

<h4 id="conclusion">Conclusion</h4>
<p>This article show how to easily obtain publicly available Historical data of a stock. In order to make use of it, check our other blog posts on how to calculate &amp; interpret stock analysis and results.</p>]]></content><author><name>Filip Zivanovic</name><email>support@exploreportfolio.com</email></author><category term="historical" /><category term="data" /><category term="download" /><category term="from" /><category term="yahoo" /><category term="finance" /><summary type="html"><![CDATA[This article show how to easily obtain publicly available Historical data of a stock. In order to make use of it, check our other blog posts on how to calculate & interpret stock analysis and results.]]></summary></entry><entry><title type="html">Calculating the Average Returns of Apple Stock - A Step-by-Step Guide</title><link href="https://blog.exploreportfolio.com/how-to-calculate-average-returns-of-a-stock/" rel="alternate" type="text/html" title="Calculating the Average Returns of Apple Stock - A Step-by-Step Guide" /><published>2023-03-18T14:46:00+01:00</published><updated>2023-03-18T14:46:00+01:00</updated><id>https://blog.exploreportfolio.com/how-to-calculate-average-returns-of-a-stock</id><content type="html" xml:base="https://blog.exploreportfolio.com/how-to-calculate-average-returns-of-a-stock/"><![CDATA[<p>Taking a simple Average of any data measurement can provide you with a great insight on how the data is distributed. The process is quite simple once you get used to it. This article will focus on how you can calculate the Average of stock returns &amp; how to interpret those results.</p>

<h4 id="first---we-need-some-data">First - we need some data</h4>

<p>Go to <a href="https://finance.yahoo.com/">Yahoo Finance</a> and download any historical data of the stock that you would like to analyze. 
You can follow the process of how to download the data and load it into Excel sheet in this article: 
<a href="/how-to-download-historical-data-from-yahoo-finance/">How to download historical stock data from Yahoo Finance?</a>.</p>

<p>Let’s download Apple (AAPL) historical data from Yahoo Finance, and once data is downloaded open it in Excel:
<img src="/assets/img/Pasted%20image%2020230319175950.png" alt="Raw data downloaded from Yahoo Finance for AAPL stock" /></p>

<h4 id="calculate-daily-log-returns">Calculate daily log returns</h4>

<p>Once we have the data ready and loaded in Excel, we can calculate daily log returns of AAPL stock.
We will use the Adjusted Close Price for our analysis, and will calculate log returns using the following formula:</p>
<div class="language-plaintext highlighter-rouge"><div class="highlight"><pre class="highlight"><code>=ln(F3/F2)
</code></pre></div></div>

<p><img src="/assets/img/Pasted%20image%2020230319180122.png" alt="Calculated daily log return in Excel for specific date" /></p>

<p>Notice that here we’re calculating the log return of date 12/15/1980 by comparing the Adjusted Close Price of the previous trading day which was 12/12/1980.</p>

<p>Now we apply this formula to whole table by double clicking on the edge of Excel cell to copy the formula until the end of the table.</p>

<p><img src="/assets/img/Pasted%20image%2020230319180345.png" alt="Calculate daily log returns in Excel for whole history of AAPL stock historical data that was downloaded from Yahoo Finance" /></p>

<p>That would calculate the Daily Log returns of AAPL stock for whole history of the stock:</p>

<p>toc: true
toc_sticky: true
published: true
<img src="/assets/img/Pasted%20image%2020230319180606.png" alt="Calculated Daily Log returns in Excel for whole history of APPL stock" /></p>

<h4 id="calculate-average-daily-log-returns--standard-deviation">Calculate Average daily log returns &amp; Standard deviation</h4>

<p>We now have all log returns ready for AAPL stock, and we would like to do some simple analysis by calculating Average/Mean daily returns &amp; Standard deviation of those daily log returns.
We will use the following formula in Excel to calculate Average of returns:</p>
<div class="language-plaintext highlighter-rouge"><div class="highlight"><pre class="highlight"><code>=average(H:H)
</code></pre></div></div>
<p>Column letter of all daily log returns in our example is H, this formula will calculate the average of all numeric cells in that column, and it will also ignore any non-numeric cell or an empty cell.
<img src="/assets/img/Pasted%20image%2020230319181047.png" alt="Calculate the average of daily log returns for AAPL stock historical data in Excel" />
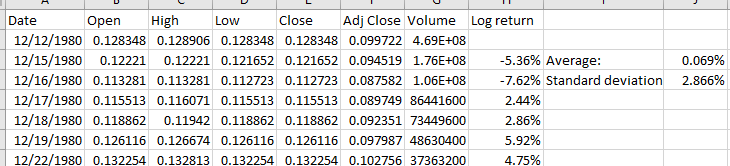
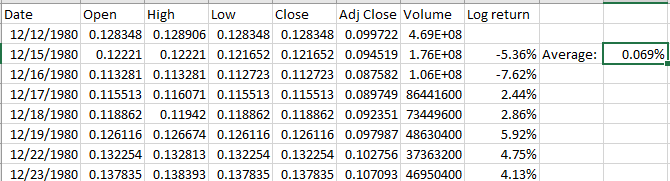
We can now see that the average daily log return was positive for whole AAPL history and it currently sits at 0.069%.
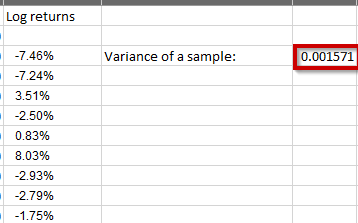
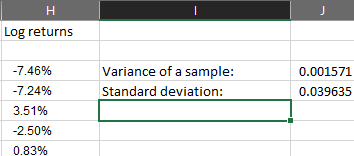
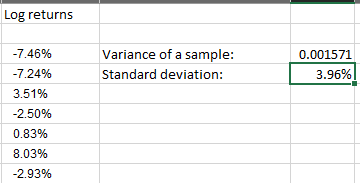
Now that we have our average, we can calculate another important metric - standard deviation of daily log returns by using the following formula in Excel:</p>
<div class="language-plaintext highlighter-rouge"><div class="highlight"><pre class="highlight"><code>=stdev.s(H:H)
</code></pre></div></div>
<p>This will calculate standard deviation of our sample which is the whole history of AAPL stock data.
<img src="/assets/img/Pasted%20image%2020230319181348.png" alt="Calculate standard deviation of the AAPL stock historical data in Excel" /></p>

<h3 id="conclusion">Conclusion</h3>
<p>This article has shown how to download and calculate daily average log returns and standard deviation for AAPL stock historical data using Excel and Yahoo Finance.</p>

<p>In our next blog post of this series we will continue with explaining how we can interpret this data and what are some guarantees that go along with it. Stay tuned.</p>]]></content><author><name>Filip Zivanovic</name><email>support@exploreportfolio.com</email></author><category term="how-to" /><category term="calculate" /><category term="blog" /><category term="average" /><category term="returns" /><category term="apple" /><category term="appl" /><summary type="html"><![CDATA[This article has shown how to download and calculate daily average log returns and standard deviation for AAPL stock historical data using Excel and Yahoo Finance.]]></summary></entry><entry><title type="html">The 5 Laws of Averages</title><link href="https://blog.exploreportfolio.com/the-five-laws-of-averages/" rel="alternate" type="text/html" title="The 5 Laws of Averages" /><published>2023-01-28T18:56:06+01:00</published><updated>2023-01-28T18:56:06+01:00</updated><id>https://blog.exploreportfolio.com/the-five-laws-of-averages</id><content type="html" xml:base="https://blog.exploreportfolio.com/the-five-laws-of-averages/"><![CDATA[<p>Average has always been considered as the best statistical estimator of the underlying normal distribution. We can think of an average as a central point of gravity for all values around it. 
I’ve gathered here The 5 Laws of Averages that should be considered always when making a practical decision.</p>

<h5 id="1-averages-dont-apply-to-individuals-by-jim-c-otar">1. Averages don’t apply to individuals! by Jim C. Otar</h5>
<p>This is an important thing to remember. As an individual, in order to learn from history and to assert any kind of informed estimate, your best choice is undoubtedly taking the average of historical data. This does not mean the estimate is useful in all situations.</p>

<h6 id="a-doctors-perspective">A doctors perspective</h6>
<p>Imagine being a doctor, and you have statistical knowledge that approximately on average 10% of patients have allergic reaction to penicillin. In decision making, per individual patient, this knowledge is not useful, even though you know that 90% of the time the patient is not going to be allergic, you still need to perform additional checks every time to be sure.</p>

<h6 id="a-gamblers-perspective">A gamblers perspective</h6>
<p>Now imagine being a gambler and having a knowledge on which side roulette wheel is going to stop for an average 90% of the time. This knowledge would make you very rich in a very short period of time.</p>

<h5 id="2-expect-the-worst-and-then-some">2. Expect the Worst and then Some</h5>

<p>When building a bridge you should strive to build a firm structure that can withhold some of the most adverse effects of nature. This means that in order to build a resilient bridge structure you should not consider the value of <strong>average</strong> wind speeds, but the <strong>worst</strong> possible and then some. 
Averages can still help to test design resilience. Finding out what is the average wind speed together with it’s standard deviation can still give you some insight and help you test your design.</p>

<p>You can then estimate the worst outcome from available data using average and standard deviation and then ensuring that you’ve covered the cases that go well beyond that point.</p>

<h5 id="3-averages-give-some-guarantees">3. Averages Give Some Guarantees</h5>

<p>Even though Averages cannot be used in individual cases or when designing resilient systems, they still provide some guarantees.
In particular, <a href="https://en.wikipedia.org/wiki/Bienaym%C3%A9%E2%80%93Chebyshev_inequality"><strong>Bienaymé–Chebyshev inequality</strong></a> guarantees that, for a wide class of probability distributions, a minimum of 75% of values are only 2 standard deviations from the mean, conversely 89% of the values are within 3 standard deviations away from the mean.</p>

<h5 id="4-trust-the-global-average-more">4. Trust The Global Average More</h5>

<p>In 1955, Professor Charles Stein of Stanford University introduced a novel revolutionary concept called “shrinkage”. The concept is unintuitive because it’s stating that somehow measuring the weight of candies, and number of World Cup attendees can improve estimates for basketball players scoring ability - if you use them together.</p>

<p>How is that possible? Obviously, those data points are completely unrelated, still if used together they produce better estimates with less risk than estimated individually.</p>

<p>Let’s use this concept with a basketball players example.</p>

<p>Each basketball player has it’s own average points scored metric. Given that’s the case, we would assume, and rightfully so, that the best estimate for that basketball player is his own average. 
James-Stein estimator proves that we can get better prediction of individual basketball players by taking a global average of all players in the world and then using a simple formula to calculate individual estimate per player:</p>

<span class="katex-display"><span class="katex"><span class="katex-mathml"><math xmlns="http://www.w3.org/1998/Math/MathML" display="block"><semantics><mrow><mi>z</mi><mo>=</mo><mrow><mover accent="true"><mi>y</mi><mo>ˉ</mo></mover><mo>+</mo><mi>c</mi><mrow><mo stretchy="false">(</mo><mi>y</mi><mo>−</mo><mover accent="true"><mi>y</mi><mo>ˉ</mo></mover><mo stretchy="false">)</mo></mrow></mrow><mi mathvariant="normal">.</mi></mrow><annotation encoding="application/x-tex">z = {\bar y + c{(y-\bar y)}}.</annotation></semantics></math></span><span class="katex-html" aria-hidden="true"><span class="base"><span class="strut" style="height:0.4306em;"></span><span class="mord mathnormal" style="margin-right:0.04398em;">z</span><span class="mspace" style="margin-right:0.2778em;"></span><span class="mrel">=</span><span class="mspace" style="margin-right:0.2778em;"></span></span><span class="base"><span class="strut" style="height:1em;vertical-align:-0.25em;"></span><span class="mord"><span class="mord accent"><span class="vlist-t vlist-t2"><span class="vlist-r"><span class="vlist" style="height:0.5678em;"><span style="top:-3em;"><span class="pstrut" style="height:3em;"></span><span class="mord mathnormal" style="margin-right:0.03588em;">y</span></span><span style="top:-3em;"><span class="pstrut" style="height:3em;"></span><span class="accent-body" style="left:-0.1944em;"><span class="mord">ˉ</span></span></span></span><span class="vlist-s">​</span></span><span class="vlist-r"><span class="vlist" style="height:0.1944em;"><span></span></span></span></span></span><span class="mspace" style="margin-right:0.2222em;"></span><span class="mbin">+</span><span class="mspace" style="margin-right:0.2222em;"></span><span class="mord mathnormal">c</span><span class="mord"><span class="mopen">(</span><span class="mord mathnormal" style="margin-right:0.03588em;">y</span><span class="mspace" style="margin-right:0.2222em;"></span><span class="mbin">−</span><span class="mspace" style="margin-right:0.2222em;"></span><span class="mord accent"><span class="vlist-t vlist-t2"><span class="vlist-r"><span class="vlist" style="height:0.5678em;"><span style="top:-3em;"><span class="pstrut" style="height:3em;"></span><span class="mord mathnormal" style="margin-right:0.03588em;">y</span></span><span style="top:-3em;"><span class="pstrut" style="height:3em;"></span><span class="accent-body" style="left:-0.1944em;"><span class="mord">ˉ</span></span></span></span><span class="vlist-s">​</span></span><span class="vlist-r"><span class="vlist" style="height:0.1944em;"><span></span></span></span></span></span><span class="mclose">)</span></span></span><span class="mord">.</span></span></span></span></span>

<p>Using this simple formula where <span class="katex"><span class="katex-mathml"><math xmlns="http://www.w3.org/1998/Math/MathML"><semantics><mrow><mi>z</mi></mrow><annotation encoding="application/x-tex">z</annotation></semantics></math></span><span class="katex-html" aria-hidden="true"><span class="base"><span class="strut" style="height:0.4306em;"></span><span class="mord mathnormal" style="margin-right:0.04398em;">z</span></span></span></span> is the new estimate for each player, <span class="katex"><span class="katex-mathml"><math xmlns="http://www.w3.org/1998/Math/MathML"><semantics><mrow><mover accent="true"><mi>y</mi><mo>ˉ</mo></mover></mrow><annotation encoding="application/x-tex">\bar y</annotation></semantics></math></span><span class="katex-html" aria-hidden="true"><span class="base"><span class="strut" style="height:0.7622em;vertical-align:-0.1944em;"></span><span class="mord accent"><span class="vlist-t vlist-t2"><span class="vlist-r"><span class="vlist" style="height:0.5678em;"><span style="top:-3em;"><span class="pstrut" style="height:3em;"></span><span class="mord mathnormal" style="margin-right:0.03588em;">y</span></span><span style="top:-3em;"><span class="pstrut" style="height:3em;"></span><span class="accent-body" style="left:-0.1944em;"><span class="mord">ˉ</span></span></span></span><span class="vlist-s">​</span></span><span class="vlist-r"><span class="vlist" style="height:0.1944em;"><span></span></span></span></span></span></span></span></span> is the grand average of all players, <span class="katex"><span class="katex-mathml"><math xmlns="http://www.w3.org/1998/Math/MathML"><semantics><mrow><mi>c</mi></mrow><annotation encoding="application/x-tex">c</annotation></semantics></math></span><span class="katex-html" aria-hidden="true"><span class="base"><span class="strut" style="height:0.4306em;"></span><span class="mord mathnormal">c</span></span></span></span> is the “shrinkage” factor and <span class="katex"><span class="katex-mathml"><math xmlns="http://www.w3.org/1998/Math/MathML"><semantics><mrow><mi>y</mi></mrow><annotation encoding="application/x-tex">y</annotation></semantics></math></span><span class="katex-html" aria-hidden="true"><span class="base"><span class="strut" style="height:0.625em;vertical-align:-0.1944em;"></span><span class="mord mathnormal" style="margin-right:0.03588em;">y</span></span></span></span> is the players average.</p>

<h5 id="5-expect-change">5. Expect Change</h5>

<p>There are only a handful phenomena in this universe that remain constant for a longer period of time. Most of the things we see around us change, some need more time, some change a lot faster. We should expect things to change, therefore we should not be surprised when that happens. 
Averages change. Fortunately, there are some easy and quick test to compare old conclusions with new data and to confirm what statisticians call <code class="language-plaintext highlighter-rouge">goodnes of fit</code>, which means that new data still matches the old one. The test is called <code class="language-plaintext highlighter-rouge">Kolmogorov–Smirnov test</code> and it’s named after <a href="https://en.wikipedia.org/wiki/Andrey_Kolmogorov">Andrey Kolmogorov</a> and <a href="https://en.wikipedia.org/wiki/Nikolai_Smirnov_(mathematician)" title="Nikolai Smirnov (mathematician)">Nikolai Smirnov</a>. Using this test we can answer the following question: “How likely is it that we would see two sets of samples like this if they were drawn from the same (but unknown) probability distribution?”, which would help us to determine if the data has changed over time and if it’s time to move on from old conclusions.</p>

<h5 id="conclusion">Conclusion</h5>

<p>Averages have been a friend of ours for a very long time. It made our lives easier, our calculations more accurate, and gave us a tool to reduce huge amount of complexity to a single number. 
In order to use it wisely, we’ve discussed some of the interesting aspects of taking an average from an array of data in this post. 
This is a start of the <code class="language-plaintext highlighter-rouge">Average</code> series of blog posts where we will dive deeper into the fascinating world of measurement, and therefore future predictions.</p>]]></content><author><name>Filip Zivanovic</name><email>support@exploreportfolio.com</email></author><category term="average" /><category term="log" /><category term="returns" /><category term="mean" /><category term="portfolio" /><category term="growth" /><category term="rate" /><summary type="html"><![CDATA[Average has always been considered as the best statistical estimator of the underlying normal distribution. We can think of an average as a central point of gravity for all values around it.]]></summary></entry><entry><title type="html">How to use market turbulence measurements?</title><link href="https://blog.exploreportfolio.com/market-turbulence/" rel="alternate" type="text/html" title="How to use market turbulence measurements?" /><published>2021-08-06T19:56:06+02:00</published><updated>2021-08-06T19:56:06+02:00</updated><id>https://blog.exploreportfolio.com/market-turbulence</id><content type="html" xml:base="https://blog.exploreportfolio.com/market-turbulence/"><![CDATA[<h3 id="main-assumptions">Main assumptions</h3>
<ul>
  <li>We can predict future path of market turbulence, since market turbulence can persist across time</li>
  <li>We can try to avoid risky assets during these turbulent periods and therefore save money</li>
</ul>

<h3 id="financial-turbulence-indicator">Financial turbulence indicator</h3>
<p>Kritzman and Li (2010) present “a mathematical measure of financial turbulence” based on the Mahalanobis Distance.</p>

<p><strong>Qualitatively:</strong> financial turbulence is a condition where</p>

<ul>
  <li>Asset prices move by an uncharacteristically large amount.</li>
  <li>Asset prices movements violate the existing correlation structure (the “decoupling of correlated assets” and the “convergence of uncorrelated assets”).</li>
  <li>If both conditions are satisfied, turbulence will be higher than if only one of the conditions are satisfied.</li>
</ul>

<p><img src="/assets/img/Pasted%20image%2020210806180039.png" alt="Market Turbulence Formula" /></p>

<p>This chart is useful to objectively assess current market turbulence conditions.</p>]]></content><author><name>Filip Zivanovic</name><email>support@exploreportfolio.com</email></author><category term="turbulence," /><category term="market," /><category term="returns," /><category term="metric" /><summary type="html"><![CDATA[Measuring market turbulence]]></summary></entry><entry><title type="html">Calculating Log Returns in Excel</title><link href="https://blog.exploreportfolio.com/how-to-calculate-log-returns-excel/" rel="alternate" type="text/html" title="Calculating Log Returns in Excel" /><published>2021-06-21T23:33:25+02:00</published><updated>2021-06-21T23:33:25+02:00</updated><id>https://blog.exploreportfolio.com/how-to-calculate-log-returns-excel</id><content type="html" xml:base="https://blog.exploreportfolio.com/how-to-calculate-log-returns-excel/"><![CDATA[<h3 id="what-is-a-log-return">What is a log return?</h3>
<blockquote>
  <p>It’s simply a change in price expressed as percentage. You often hear S&amp;P 500 is up today by 0.5%.
A log return of S&amp;P 500 for today would be 0.5%.</p>
</blockquote>

<h3 id="how-to-calculate-log-returns-in-excel">How to calculate log returns in Excel?</h3>

<p>First you’ll need some data, you can get it for free on Yahoo! Finance website.
Here in our example we’ll use BTC/USD, you can download it <a href="https://finance.yahoo.com/quote/BTC-USD/history?p=BTC-USD">here</a>.</p>

<p>When you download the file, it will be a CSV file which you can open with Excel like any other CSV file. It will look like this:</p>

<p><img src="/assets/img/Pasted%20image%2020210621213222.png" alt="Yahoo Finance prices excel csv file" /></p>

<p>Now, that you have the data ready, we start calculating log returns. In calculating returns we always skip the first data point, because we need to calculate <em>the difference</em> between current day and previous day.</p>

<p>The formula in Excel for calculating our fist log return in our example is:</p>

<div class="language-plaintext highlighter-rouge"><div class="highlight"><pre class="highlight"><code>=ln(f3/f2)
</code></pre></div></div>

<p>Pasting that formula will give you similar result like the this screenshot:</p>

<p><img src="/assets/img/Pasted%20image%2020210621214412.png" alt="Log returns of daily prices" /></p>

<p>Now, we just apply this formula for all the following cells in the H column, and we apply some formatting to get it to look like this:
<img src="/assets/img/Pasted%20image%2020210621214551.png" alt="Formatted log returns as percentages" /></p>

<p>We now have our log returns ready, but what can we do with them?</p>

<p>Check these tutorials to continue:</p>
<ul>
  <li><a href="/variance-example-bitcoin/">Variance example: Bitcoin/USD</a></li>
</ul>]]></content><author><name>Filip Zivanovic</name><email>support@exploreportfolio.com</email></author><category term="log" /><category term="returns" /><category term="excel" /><category term="percent" /><category term="daily" /><category term="monthly" /><summary type="html"><![CDATA[Calculating log returns in Excel]]></summary></entry><entry><title type="html">Variance example Bitcoin/USD</title><link href="https://blog.exploreportfolio.com/variance-example-bitcoin/" rel="alternate" type="text/html" title="Variance example Bitcoin/USD" /><published>2021-06-21T23:18:08+02:00</published><updated>2021-06-21T23:18:08+02:00</updated><id>https://blog.exploreportfolio.com/variance-example--bitcoin</id><content type="html" xml:base="https://blog.exploreportfolio.com/variance-example-bitcoin/"><![CDATA[<p>Bitcoin and cryptocurrencies are considered a high risk asset at this moment, the <em>riskiness</em> part is more likely attributed because of the volatility it has shown through years and because it’s a relatively new asset.</p>

<p>Value of a Bitcoin is usually expressed by comparing it to USD, and a value of one BTC is currently at the time of this writing around 33 000$ (06/21/2021). Now, no one can predict the future, BTC might go up or go down - we don’t know that.</p>

<p>What <a href="/variance-of-portfolio/">variance</a> is telling us how it feels to ride the BTC chart.</p>

<p><img src="/assets/img/Pasted%20image%2020210621212902.png" alt="People on a roller coaster" /></p>

<p>Everyone knows that BTC is a wild ride, but can we express that in a single number? Yes, we can, it’s called price variance.</p>

<h3 id="how-to-calculate-bitcoin-btcusd-variance-using-excel">How to calculate Bitcoin (BTC/USD) variance using Excel?</h3>

<p>Simple, first you need price data. You can get one for free from Yahoo <a href="https://finance.yahoo.com/quote/BTC-USD/history?p=BTC-USD">here</a>.
By clicking on a download button, you’ll get a CSV file that you can open in Excel like this:</p>

<p><img src="/assets/img/Pasted%20image%2020210621213222.png" alt="Bitcoin log returns in Excel image" /></p>

<h4 id="now-that-you-have-data-well-need-to-calculate-log-returns">Now that you have data, we’ll need to calculate <a href="./202106212133-log-returns">log returns</a></h4>

<p>When we have the <a href="./202106212133-log-returns">log returns</a> column ready, we can start calculating variance by using the following Excel formula:</p>

<div class="language-plaintext highlighter-rouge"><div class="highlight"><pre class="highlight"><code>=VAR.S(H3:H2466)
</code></pre></div></div>

<p><img src="/assets/img/Pasted%20image%2020210621220423.png" alt="Bitcoin sample variance calculated in Excel image" /></p>

<p>Variance on it’s own does not tell us a lot about data, but we can transform it to standard deviation and also compare with other assets to get a clear picture which asset is more volatile.
Standard deviation is just a square root of variance, as shown with Excel formula here:</p>

<div class="language-plaintext highlighter-rouge"><div class="highlight"><pre class="highlight"><code>=SQRT(J3)
</code></pre></div></div>

<p><img src="/assets/img/Pasted%20image%2020210621220652.png" alt="Bitcoin standard deviation calculated in Excel image" /></p>

<p>Now, a standard deviation is a metric on it’s own, it’s often called volatility of an asset. You can learn more about it <a href="./202106212209-standard-deviation">standard deviation</a>.</p>

<p>Standard deviation of log returns can also be expressed with percentages, like here:</p>

<p><img src="/assets/img/Pasted%20image%2020210621221110.png" alt="Standard deviation of log returns" /></p>

<p>A measured volatility of daily log returns for BTC/USD on a day of writing this tutorial is: 3.96%.</p>

<p>Now, you can calculate standard deviation (volatility) of other assets and compare them to see which is more volatile between them.</p>]]></content><author><name>Filip Zivanovic</name><email>support@exploreportfolio.com</email></author><category term="variance" /><category term="standard" /><category term="deviation" /><category term="btc" /><category term="usd" /><category term="bitcoin" /><category term="analysis" /><category term="cryptocurrencies" /><summary type="html"><![CDATA[Analysis of Bitcoin/USD (BTC/USD) variance and standard deviation]]></summary></entry><entry><title type="html">Variance</title><link href="https://blog.exploreportfolio.com/variance-of-portfolio/" rel="alternate" type="text/html" title="Variance" /><published>2021-06-21T22:54:09+02:00</published><updated>2021-06-21T22:54:09+02:00</updated><id>https://blog.exploreportfolio.com/variance-of-portfolio</id><content type="html" xml:base="https://blog.exploreportfolio.com/variance-of-portfolio/"><![CDATA[<h3 id="what-is-variance">What is Variance?</h3>
<blockquote>
  <p>Variance is a measure how volatile some data stream is. It tries to give us an answer in a form of a number on the following questions:</p>
  <ul>
    <li>What is the spread between data points?</li>
    <li>By how much those data points on average jump around?</li>
  </ul>
</blockquote>

<h3 id="how-is-it-applied-to-finance--risk-management">How is it applied to finance &amp; risk management?</h3>
<p>Financial asset price (or any other metric) is just a stream of data. It’s a stream because we get new data point each second/minute.
If the price of an asset changes a lot, and jumps up and down a lot - we would consider that to be a volatile (high variance) asset price.</p>

<p>Example of high (blue line) and small variance (red line) in amplitudes shown in this image
<img src="/assets/img/Pasted%20image%2020210621210758.png" alt="Example of high and small variance in amplitudes" />
<a href="https://www.allaboutcircuits.com/technical-articles/average-deviation-standard-deviation-variance-signal-processing/">Image source</a></p>

<p>Now, that doesn’t mean that all variances are bad. For example, a price can jump, but always jump up - that is a very desirable situation for someone who bought the asset at the right time.</p>

<p>Variance is best explained through examples:</p>
<ul>
  <li><a href="/variance-example-bitcoin/">Variance example: Bitcoin/USD</a></li>
</ul>]]></content><author><name>Filip Zivanovic</name><email>support@exploreportfolio.com</email></author><category term="variance" /><category term="standard" /><category term="deviation" /><category term="portfolio" /><category term="risk" /><category term="measure" /><summary type="html"><![CDATA[Variance of the portfolio]]></summary></entry></feed>