
Calculating the Average Returns of Apple Stock - A Step-by-Step Guide
Taking a simple Average of any data measurement can provide you with a great insight on how the data is distributed. The process is quite simple once you get used to it. This article will focus on how you can calculate the Average of stock returns & how to interpret those results.
First - we need some data
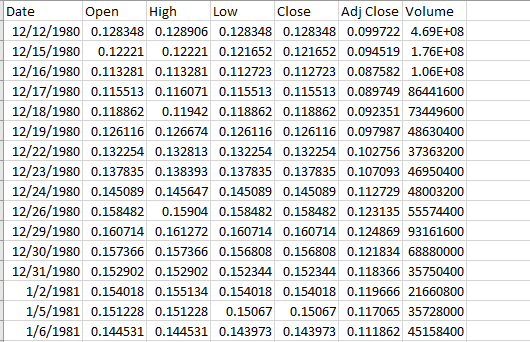
Go to Yahoo Finance and download any historical data of the stock that you would like to analyze. You can follow the process of how to download the data and load it into Excel sheet in this article: How to download historical stock data from Yahoo Finance?.
Let’s download Apple (AAPL) historical data from Yahoo Finance, and once data is downloaded open it in Excel:
Calculate daily log returns
Once we have the data ready and loaded in Excel, we can calculate daily log returns of AAPL stock. We will use the Adjusted Close Price for our analysis, and will calculate log returns using the following formula:
=ln(F3/F2)
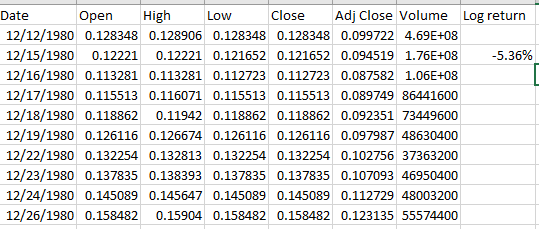
Notice that here we’re calculating the log return of date 12/15/1980 by comparing the Adjusted Close Price of the previous trading day which was 12/12/1980.
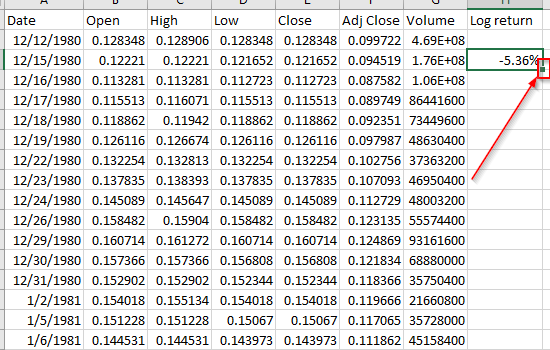
Now we apply this formula to whole table by double clicking on the edge of Excel cell to copy the formula until the end of the table.
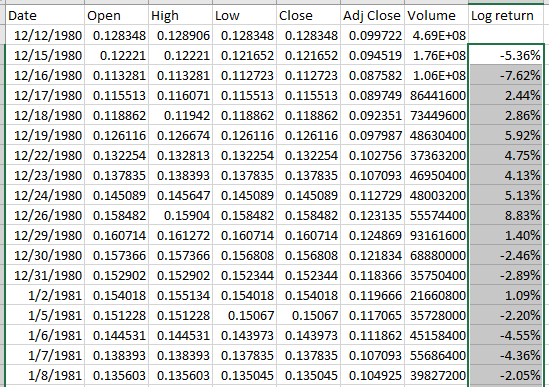
That would calculate the Daily Log returns of AAPL stock for whole history of the stock:
toc: true
toc_sticky: true
published: true
Calculate Average daily log returns & Standard deviation
We now have all log returns ready for AAPL stock, and we would like to do some simple analysis by calculating Average/Mean daily returns & Standard deviation of those daily log returns. We will use the following formula in Excel to calculate Average of returns:
=average(H:H)
Column letter of all daily log returns in our example is H, this formula will calculate the average of all numeric cells in that column, and it will also ignore any non-numeric cell or an empty cell.
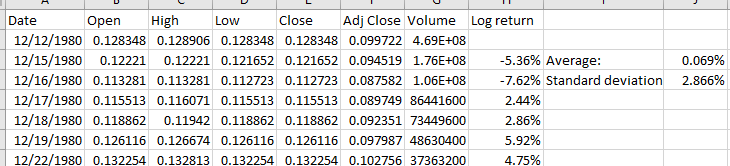
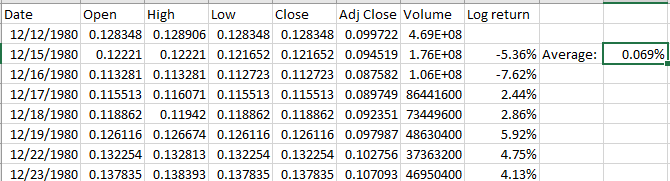 We can now see that the average daily log return was positive for whole AAPL history and it currently sits at 0.069%.
Now that we have our average, we can calculate another important metric - standard deviation of daily log returns by using the following formula in Excel:
We can now see that the average daily log return was positive for whole AAPL history and it currently sits at 0.069%.
Now that we have our average, we can calculate another important metric - standard deviation of daily log returns by using the following formula in Excel:
=stdev.s(H:H)
This will calculate standard deviation of our sample which is the whole history of AAPL stock data.
Conclusion
This article has shown how to download and calculate daily average log returns and standard deviation for AAPL stock historical data using Excel and Yahoo Finance.
In our next blog post of this series we will continue with explaining how we can interpret this data and what are some guarantees that go along with it. Stay tuned.