
Variance example Bitcoin/USD
Bitcoin and cryptocurrencies are considered a high risk asset at this moment, the riskiness part is more likely attributed because of the volatility it has shown through years and because it’s a relatively new asset.
Value of a Bitcoin is usually expressed by comparing it to USD, and a value of one BTC is currently at the time of this writing around 33 000$ (06/21/2021). Now, no one can predict the future, BTC might go up or go down - we don’t know that.
What variance is telling us how it feels to ride the BTC chart.

Everyone knows that BTC is a wild ride, but can we express that in a single number? Yes, we can, it’s called price variance.
How to calculate Bitcoin (BTC/USD) variance using Excel?
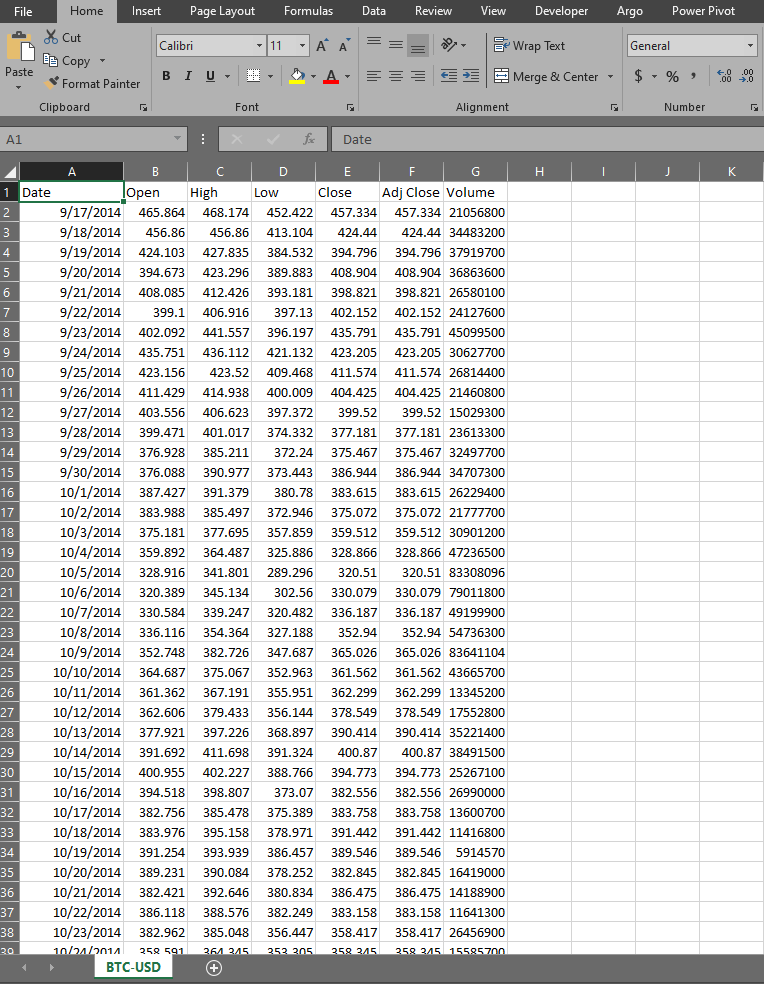
Simple, first you need price data. You can get one for free from Yahoo here. By clicking on a download button, you’ll get a CSV file that you can open in Excel like this:
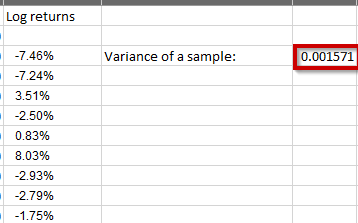
Now that you have data, we’ll need to calculate log returns
When we have the log returns column ready, we can start calculating variance by using the following Excel formula:
=VAR.S(H3:H2466)
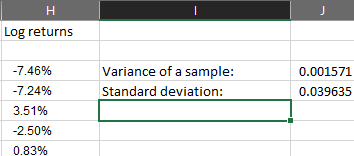
Variance on it’s own does not tell us a lot about data, but we can transform it to standard deviation and also compare with other assets to get a clear picture which asset is more volatile. Standard deviation is just a square root of variance, as shown with Excel formula here:
=SQRT(J3)
Now, a standard deviation is a metric on it’s own, it’s often called volatility of an asset. You can learn more about it standard deviation.
Standard deviation of log returns can also be expressed with percentages, like here:
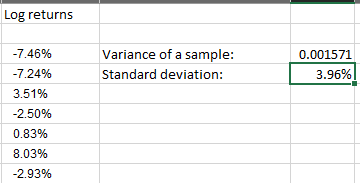
A measured volatility of daily log returns for BTC/USD on a day of writing this tutorial is: 3.96%.
Now, you can calculate standard deviation (volatility) of other assets and compare them to see which is more volatile between them.