
Variance
What is Variance?
Variance is a measure how volatile some data stream is. It tries to give us an answer in a form of a number on the following questions:
- What is the spread between data points?
- By how much those data points on average jump around?
How is it applied to finance & risk management?
Financial asset price (or any other metric) is just a stream of data. It’s a stream because we get new data point each second/minute. If the price of an asset changes a lot, and jumps up and down a lot - we would consider that to be a volatile (high variance) asset price.
Example of high (blue line) and small variance (red line) in amplitudes shown in this image
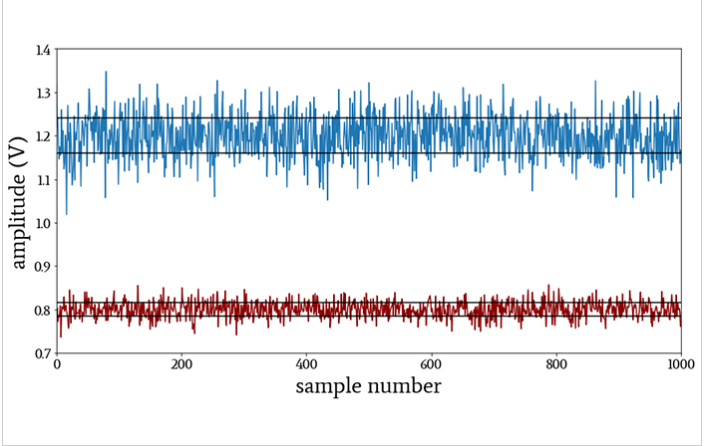 Image source
Now, that doesn’t mean that all variances are bad. For example, a price can jump, but always jump up - that is a very desirable situation for someone who bought the asset at the right time.
Variance is best explained through examples: